
I’m keen to start retirement early. My bucket list is long and I’d like to get a head start. Oh, you too?
That made me wonder: How much do you really need to retire?
Maybe you want to spend time writing. Or go to pastry school. Or just travel nomadically. Well, you’ll need a nest egg that lasts to make it happen.
Ideally, you’d earn just enough to fund your spending needs for life, without sacrificing living standards, but not earn so much that you have to work unnecessary longer years to get it.
It’s a tricky balance. Aim too low, and you might end up penniless when you’re old and frail. Aim too high and give up precious years working at a job you may not like.
Getting your nest egg number right starts with 2 fundamental questions:
- What does your target retirement lifestyle cost annually?
- How many years do you expect to need your retirement funds to last?
These answers shape your entire analysis, so think hard about them.
If you have to take a big spending hit in retirement, it’s not a win. And if you have to work decades longer, it’s not a win.
Let’s walk through some key retirement analysis concepts and then analyze your specific retirement scenario. Here’s what we’ll cover…
The 4 percent rule, a recap
Imperfections with the 4 percent rule
Past success is not a guarantee of future performance
First, try not to DIE
Where to buffer your assumptions and adapt to change
What the data shows
Post-financial crisis refresh of the 4 percent rule
How do things change with such low interest rates and investment yields?
What’s it all mean for you?
Overview of the retirement analysis spreadsheet
Key drivers of your retirement analysis
Where your projections will be the most sensitive
Other assumptions that are less important, but should note
Summary takeaways
Now it’s your turn: What is YOUR retirement number?
The 4 percent rule, a recap

In 1994, a financial planner by the name of Bill Bengen tried to help his clients answer the question: How much can you spend annually in retirement without running out of money?
If you know your annual number, you can infer the savings number needed to support that spending level.
Bengen crunched a bunch of data and came up with a heuristic that is now the most widely referenced rule of thumb for retirement spending.
He called it the 4 percent rule.
The 4 percent rule says you can confidently spend 4 percent of your initial portfolio In Year 1 of retirement, and then adjust that amount for inflation every year afterward. If you do this, your portfolio will most likely last at least 30 years, and often longer.
Seems straightforward: save 25x of your first-year needs and you’re golden.
Need $50,000 your first year? Save $1.25 million.
Need $100,000? Save $2.5 million.
Note Bengen’s study assumed a 50-50 split between stocks and bonds.
Bengen also assumed portfolios are rebalanced annually back to the target 50-50 and that the annual 4 percent + inflation withdrawal (the safe withdrawal rate) covers ALL expenses, including taxes and investment fees.
So, obviously you can see that if you’re paying, say, a 1 percent management fee to a traditional advisor, that’s 25 percent of your annual withdrawal. Likewise, a 25 percent overall tax rate sucks away another percent.
4 percent vs. 2 percent in consumption spending makes a huge difference. Huge. So minimizing taxes and fees is critical.
That means thoughtful tax planning strategy and using diversified, low cost ETFs like VTI plus brokerages that charge zero maintenance and trading fees.
This blog will show you how to do these.
Anyway, given these assumptions, Bengen tested his hypothesis for every 30-year period from 1926-1994 and found that 4 percent as the “safe withdrawal rate” succeeded almost every time…96 percent of the time, in fact.
Imperfections with the 4 percent rule
But if you succeed 96 percent of the time, what about the other 4 percent? Yep, you ran out of money before 30 years.
But some folks won’t feel confident with ANY risk of their money running out before they die, no matter how small.
So, you might think they should just save a bigger nest egg so they can spend less than 4 percent when they retire. Maybe they’ll only need to spend 3 percent or 2 percent to “guarantee” their portfolio won’t die before they do.
But inflating your nest egg so you can drop your spend to 3 or 2 percent will take a LOT of effort.
If you need $50,000 your first year, you need to inflate your portfolio more than $400k extra, from $1.25 million to $1.67 million, just to lower your withdrawal rate to 3 percent.
You need to double it to $2.5 million to lower the withdrawal to 2 percent.
That means working many extra years to build up your nest egg that much more.
But that’s not risk-free, either. With so much more savings, you could be left with a lot of extra money at the end of your life, which creates new headaches around shielding inheritance bequests from taxes – maybe not federal estate taxes, but possibly state estate taxes.
Worst case, your retirement itself may fall short of 30 years because…well, you die.
So, unless you intend to leave a big estate to your heirs, do you really want to bust your ass working so much longer if it may not ultimately make a difference?
Still, past success is not a guarantee of future performance

The 4 percent rule is not a law of nature. It is a heuristic based on historical observation.
So, even if you manage to double your portfolio size (no small feat), as the last hundred years taught us, you can’t eliminate risk because you can’t prevent big catastrophes from happening.
In the last 100 years, we had:
- the great depression
- World War II
- 1970s oil embargo shocks, twice
- 9/11
- 2008 financial meltdown
- COVID-19
Just to name a few favorite memories.
Even if you plan perfectly, a big retirement portfolio won’t stop, e.g., potential economic collapse in other countries, a capital exodus from China, or a terrorist attack in Manhattan. You can’t control global macro events that could wipe you out, and it’s not terribly productive to spend time worrying about it.
You should build a reasonably sized portfolio and be thoughtful and monitor your spending, always with a long-term horizon.
But don’t waste time building too much buffer to hedge against every possible outcome. If the “big one” comes, you’ll have plenty of other stuff to worry about.
First, try not to DIE

Actually, if you want to increase the odds you’ll be able to enjoy all those retirement years you planned for, a better use of energy is to take care of yourself so you don’t DIE before 30 years is up. Say you retire at 55 or even 45. Your odds of living to 85 or 75 are definitely less than 96 percent. Shouldn’t you try to up those odds first before worrying about a potential nest egg shortfall?
Better spend more time exercising, eating healthy, keeping your mind sharp, and staying social with friends to ensure a long happy life.
Bottom line, don’t worry about making your portfolio’s longevity bulletproof. It’ll never be 100 percent. The only thing that’s 100 percent is DYING, so try to avoid that in your first 30 years of retirement, cool?
Where to buffer your assumptions and adapt to change

OK, there were other important assumptions in Bengen’s study. It assumes you get no social security, no other income in retirement, there are no decreases in spending ever, basically no flexibility.
These assumptions tilt the 4 percent rule even more conservatively in your favor, ‘cause it means the margin of safety for your withdrawal rate is larger.
For this post, I built a robust retirement spreadsheet calculator to help you analyze your own retirement portfolio.
You should check it out. I make similar assumptions as Bengen in this regard: assume no dependency on Social Security or Medicare.
It’s a good psychological buffer to know that if you can make the numbers work even when those assumptions are zero, your odds of success are even greater than 96 percent. ‘Cause in all likelihood, not ALL those assumptions will actually turn out to be zero.
As long as you’ve worked like a normal person, you’re most likely gonna get some Social Security.
Similarly, if your investments go into the crapper, are you really gonna think, “Well, the experts say I can spend 4 percent, so blow me, Mr. Stock Market!”
I’d tighten my spending, as would most others.
If you plan to travel in retirement, you could mitigate the portfolio stress caused by a stock crash by starting your travels in less expensive countries.
Instead of starting out wandering the streets of Paris and Florence trying to relive old college dreams, why not learn to surf in Baja Mexico, or traipse through the old bazaars of Istanbul, or learn to tango in Argentina? Argentina has tasty steaks.
As well, if you retire early, who’s to say you won’t earn some extra cash on the side? You might start a side business, do consulting, write freelance, teach guitar, or sell crafts online.
With all that extra free time, who wouldn’t be interested in earning some extra cash along the way, especially if you’re doing things you enjoy and you’d do them anyway? The odds you’d have at least a little bit of income at some point in retirement seems reasonable.
What the data shows

Let’s get into the meat of the study’s findings.
The core insights of Bengen’s study, with data updated through 2009, is shown below.
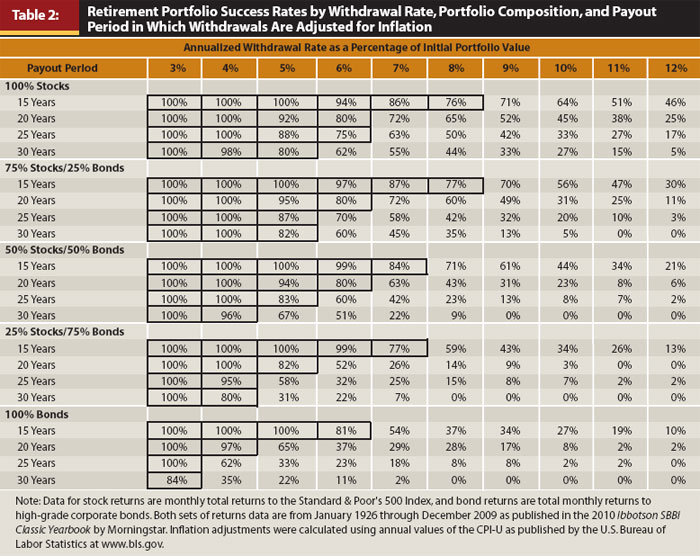
The table shows how often, over 84 years of actual investment returns, your portfolio would have sufficiently funded X years of living expenses at certain withdrawal rates.
For example, if your portfolio was 50 percent diversified stocks and 50 percent investment grade bonds, you’d have money leftover after 30 years in 96 percent of the years analyzed, assuming you drew 4 percent of your portfolio in Year 1 and adjusted for inflation annually afterward.
The study also predicts the median value of your remaining portfolio at the end of 30 years.
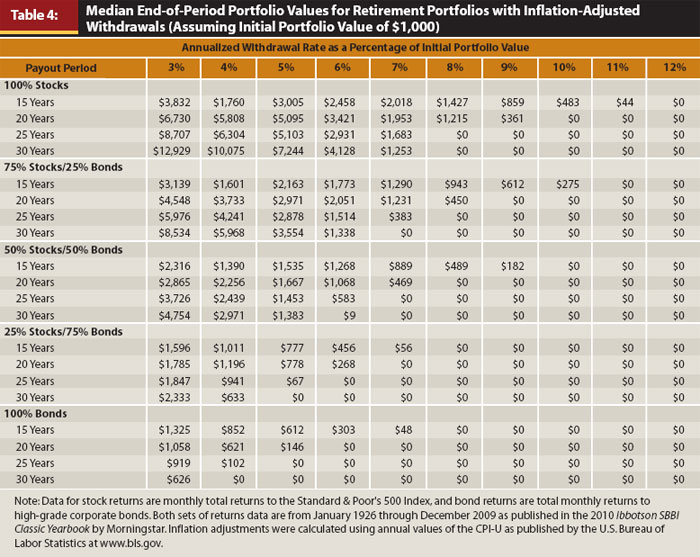
So, for a $1 million 50-50 stock / bond portfolio drawing 4 percent in Year 1, the median terminal value at the end of 30 years is almost $3 million.

You actually MAKE money in the median case during retirement. And not a little, a lot. 3x lot!
Of course, that’s the median, and the variance is large, including 4 percent of years analyzed which ended negatively because the portfolio wasn’t enough to last 30 years in the first place.
Post-financial crisis refresh of the 4 percent rule
In more recent years, one of Bengen’s colleagues Wade Pfau updated that original study to extend through 2014, which factors in the financial meltdown of 2008.
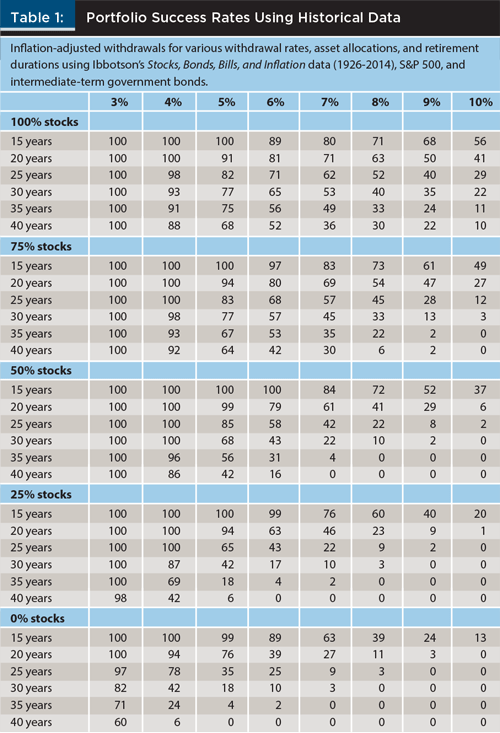
As you can see, the numbers change a little bit, but the shape of the “curves” don’t fundamentally shift.
Pfau says that’s because the portfolio’s longevity is more dependent on how the early years perform than later years. He says the data show that “the wealth remaining 10 years after retirement combined with the cumulative inflation during those 10 years can explain 80 percent of the variation in a retiree’s maximum sustainable withdrawal rate after 30 years.”
So, if you can get through the first 10 years of retirement without your portfolio getting hammered by either a stock crash or runaway inflation or excessive withdrawals, then your chances of your portfolio lasting through the end skyrocket. The first 10 years of your runway matters most.
You can help assure a good outcome with some planning.
For instance, as mentioned above, say you want to travel long-term in retirement. With a 30, 40, 50 year retirement horizon, you’ve got plenty of time to see it all.
While you can’t control stock performance or inflation, you can cushion your withdrawals by front loading inexpensive countries in the early years to increase your portfolio’s runway. You’re not giving up any travels to Paris or Rome; you’re just shifting the sequence.
Lifestyle arbitrage FTW!
How do things change with such low interest rates and investment yields?

Pfau also analyzed a second twist to Bengen’s original study which accounted for the fact that, since the financial crisis of 2008, interest rates have remained low for years. This has had profound implications for retirement savers because it meant low yields for an extended time, especially those overindexed in bonds (as many retirees are).
If a large percent of your portfolio was bonds from 2009 until now, you were SOL. Equity markets soared magnificently, but bond markets languished.
So Pfau computed new predicted success rates to account for today’s ultra-low interest rates and found that success rates dropped a lot, because growth in bond-weighted retiree portfolios stalled in the low interest rate environment.
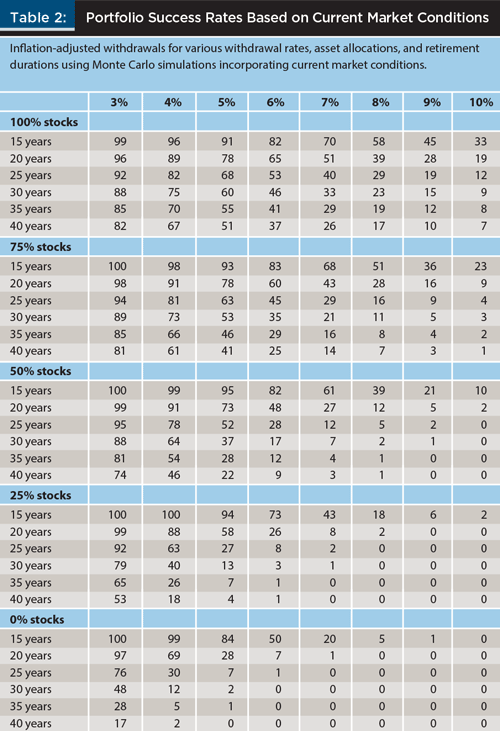
As you can see, success rates are considerably bleaker with this adjustment.
What’s it all mean for you?

You must be thinking, that’s interesting and all, but what’s all this really mean for ME? For MY retirement situation.
Good question. Because running Monte Carlo simulations with historicals is interesting but it’s backward looking, and past results don’t guarantee future performance.
So to understand what it means for you — for your retirement number — you HAVE to get down and dirty and model projections about your own future, line by line.
Luckily, I’m gonna show you how.
First open up this bad boy:
It’s a plug and play Google spreadsheet model I built for you that’ll help you get a good feel for how your income, expenses, and investment assets interact both during your accumulation phase and during retirement.
The way it works is similar to modeling a company income statement. You tweak variables to see how much impact certain inputs have on your portfolio. Some, like inflation rate and investment return rate, have HUGELY disproportionate impact.
Anyway, I encourage you to play around with it so you can better understand your own retirement number.
Let’s hop to it!
Overview of the retirement analysis spreadsheet
There are two worksheets in the model.
On the “Inputs” worksheet, fill out the left-hand section labeled “Inputs / Assumptions.”
Just fill in the yellow cells, then all the values and outputs in the model will update automatically.
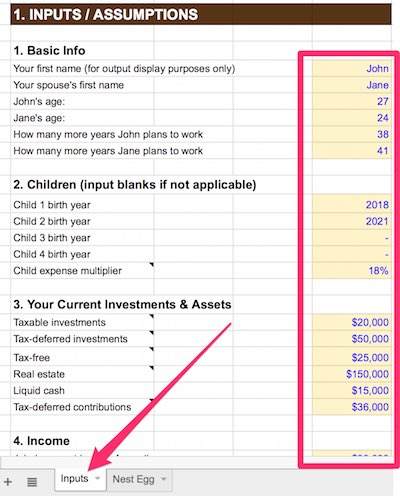
Note that if you’re single, you can just leave blank the cells for spouses and children. The model will compute you as a single retiree. If you have a spouse but no kids, just fill out the spouse cells but leave the children cells blank. If you have only one kid, leave the other three children cells blank.
The model can accommodate any family situation, up to four children. I assume each additional child adds 18 percent to the family budget by default, but you can change this value if you have an expensive kid.
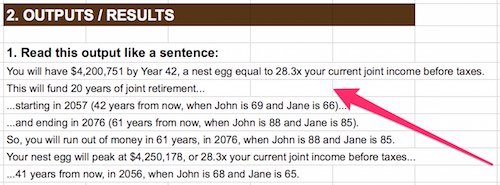
Once you finish filling in the yellow cells on the left, look at the “Outputs / Results” on the right. It will automatically spit it out a sentence-based description of your key retirement portfolio statistics, such as the year your portfolio peaks, how many years your runway is, and when you will run out of money.
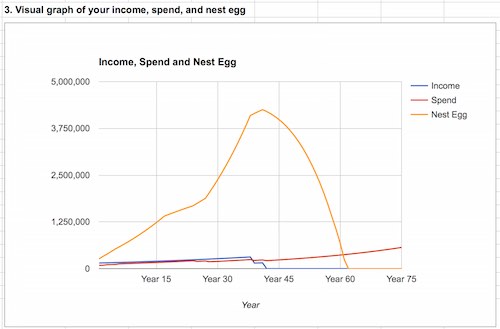
At the lower right, I also have a chart plotting your income, spending, and portfolio assets. You can visually see how they interact with each other and how your portfolio grows, peaks, and then starts dropping.
Key drivers of your retirement analysis

There are numerous drivers to the model, but the most important ones are
- Your existing investments / assets – i.e., how big of a nest egg you’re starting with
- Your income and expected income growth
- Your savings rate after all expenses and taxes
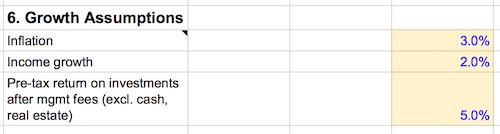
- Inflation rate
- Investment return rate
In real life, it also matters what percent of your income you invest vs. just save in cash. Putting your capital to work and being methodical and rigorous about capturing compound interest and growth, and doing it from an early age, is likely the most important factor in achieving financial independence asap.
My model assumes you invest ALL net savings in tax-deferred accounts, since there are no income limits to tax-deferred accounts like 401ks or IRAs, which isn’t true for Roths.
You can edit the spreadsheet logic to make your net savings flow into the tax-free accounts line item instead, but it shouldn’t make much difference to the overall analysis: i.e., your peak nest egg size and how many retirement years it will fund.
In real life, it also matters how tax efficient you are with specific investments – in terms of housing each asset in its most favorably taxed account. Different investments behave differently in tax-exempt, tax-deferred, preferentially taxed, or ordinarily taxed accounts.
For example, if you are in the 0% capital gains bracket, you might want to put your qualified dividend generating stocks or any tax-free municipal bonds in your taxable account since they won’t get taxed anyway.
If you feel confident you won’t lose the money, you might want to put your highest growth stocks in tax-free Roths since everything is tax-free at withdrawal. Downside is, if you get wiped out or have a capital loss, you can’t claim an offset against anything.
You may want to put assets which generate non-qualifying cash flows, such as bonds or international stocks, in a tax-deferred 401k or IRA since the growth is tax-free and you can convert it to Roth later. (If you live abroad, you could also put international stocks in your taxable account and then use the foreign tax credit to offset US taxes – that might be preferable since a Roth or 401k doesn’t shield you from foreign taxes, only US taxes.)
Where your projections will be the most sensitive
The most sensitive drivers to your retirement analysis hands down are going to be inflation + investment growth rate.
Inflation because it impacts your entire cost base and keeps growing until you die. It especially matters if you spend a majority of your income every year. By contrast, if you save a majority of your income, then inflation matters less than income growth. Because then, more raw dollars drop to your bottom line when your income grows fast. Basically, whichever growth rate, inflation growth or income growth, causes more raw dollars to drop to your bottom line is the more influential of the two.
Rate of investment return is very influential in the model because of the effect of compound growth.
The model assumes a simplistic blended investment growth rate across all asset classes. This should be sufficient to get a feel for overall portfolio growth, as overall growth is ultimately what matters, but it also makes getting this number right especially important. If it’s wrong, it’ll swing your ending portfolio value by a lot. I like to play with different growth rates to see a spread of possible outcomes and get a feel for a range of scenarios: downside, base, and upside cases.
An important caveat. The model does not factor in investment volatility which can occur year to year. It is impossible to predict volatility, so the model assumes you are investing for the long-term, i.e., holding periods of 10+ years, when volatility typically has enough time to correct itself and smooth out longer-term trends.
So the model assumes linear compound growth. But volatility is important to keep in mind because of what we mentioned earlier about the first 10 years mattering much more than later years.
To account for this uncertainty, I personally just assume a lower linear growth rate, even though this disproportionately punishes my entire retirement analysis. For example, if I think the true investment growth rate is 7%, I might assume 6% to account for volatility. This shortens my retirement runway considerably, but it’s also a psychological buffer that is a margin of safety: if you can still make the numbers work, it’s a good sign.
Other assumptions that are less important, but should note
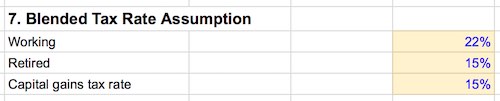
The model assumes taxes rates remain stable year to year, so you only have the ability to specify 3 tax rates: a blended tax rate during your working years, a tax rate during your retirement years, and a blended capital gains rate.
The model also assumes your income and expenses grow steadily and are not volatile, so this would make analysis difficult for someone with irregular income, like entertainers, freelancers, entrepreneurs, etc. (You can always edit the spreadsheet manually to input fluctuating income amounts, but that’s not the way the model is set up.)
Summary takeaways

When you boil it all down, it’s pretty simple.
- Save as much as you can – the more you save, the more freedom you buy with each passing work year
- Invest your savings and make your capital WORK for you. Capture compound interest growth as early as possible, for as long as possible
- A 4 percent withdrawal in your first retirement year is a guideline, a reference point, but not a law of nature
- Don’t worry about attaining 100 percent certainty that your portfolio will outlive you — no guarantee is possible, if the big one comes it’ll wipe out everyone anyway, and if you manage your portfolio wisely you’ll maximize your chances for all scenarios
- Aggressively manage your portfolio during the first 10 years — it has huge disproportionate impact on the rest of your retirement
- You can’t control investment returns (beyond picking your investments wisely) or overall inflation, but you can spend less in the early years of retirement to mitigate the impact on your portfolio
- House your investments in accounts where they’ll receive the most favorable tax treatment; avoid management fees by using fee-free brokerage accounts and low-cost index funds. Skip a financial advisor until you have multiple millions
- Think about ways you might earn side income, even in retirement, to further mitigate impact on your portfolio – if you enjoy it and are going to do it anyway, it’ll seem less like work!
Now it’s your turn: What is YOUR retirement number?

First, get our Retirement Savings Calculator to run your retirement analysis.
I encourage you to play with the inputs and see how they impact your retirement analysis. Run a range of cases to get a feel for upside and downside scenarios. It’ll be eye-opening for you to see what it means in terms of your retirement runway, nest egg size, and how long you have to work to build it all up.
At its most powerful, this insight can influence how you budget, earn, spend, and save. It can give you milestones to work toward and targets to shoot for.
And developing that mental model for achieving concrete goals, financial or otherwise, is very empowering. It’ll help you create structure and discipline in your efforts to build wealth. Being able to look back at your milestones and get that dopamine rush when you achieve them will help keep you motivated and on track.
Want more online calculators to play around with? Check these out.
- http://www.fourpercentrule.com: This 4 percent rule web-based calculator will spit out similar results as my spreadsheet model, but you won’t be able to see any annual data.
- http://www.cfiresim.com: This tool lets you run simulations against historical years to see how your portfolio would have ended based on any start year.
Plus: be sure to check out our companion post: How long will your savings last in retirement?
What about you: What’s your retirement number? What strategies or heuristics do you think about to maximize your portfolio / retirement runway and minimize risk? Leave a comment below and let me know!

This makes the assumption of a constant 4% withdrawal rate in retirement.
You can’t control the market when investing into the market, so dollar cost averaging makes sense. However, you have much more control when you take it out.
What do you think would be the effect of modifying based on market performance? For example, adjusting spending down to 3% if the market is down in a year and perhaps up to 5% if the market is strong? This would impact variable retirement costs. Vacation destinations, etc..
It would seem to me to allow you to stay more geared towards equities for long term growth.
I realize that there is a limit to the amount and type of modeling here. But curious if you had any thoughts on the modified strategy?
Hey Matt – yeah, modifying based on market performance is a widely adopted strategy. And realistically, it’s what I believe most investors will do if the poop hits the fan. As I wrote in the post, if my investment holdings go into the crapper, am I really gonna think, “Well, the experts say I can spend 4 percent, so blow me, Mr. Stock Market!” Nah, I’d tighten my spending, as would most others. You can pull levers like traveling to cheaper vacation destinations, eating out less, etc, to accommodate that temporary withdrawal reduction. As well, if you really have to, you can always do some freelance or consulting work to earn some extra cash on the side to help weather a tough year so that you don’t invade your nest egg too badly: just because you retire doesn’t mean you can’t still earn some money — after all, retirement gives you the time to! (Now, if you want to be able to restart a full-blown career, that’s a different story.)
Finally, as I wrote in the post, market swings impact a portfolio’s longevity far more in the first 10 years (or first third of the retirement period) than in remaining years. So, bottom line: if you can get through the first third of retirement without the market or inflation hammering your portfolio, then your chances of outliving your portfolio go way up. The first third matters the most.
I like the spreadsheet. Tried to make one for myself, and got confused with the numbers. This is much better.
I’m one of the lucky ones with a defined benefit pension plan that will pay out 70% of my pre-retirement income annually for life.
I didn’t see a place to put this data on the spreadsheet. A line on the spreadsheet for ‘retirement income’ could cover both side-businesses and defined-benefit retirement plans. I suppose it should be inflation-linked too.
Thanks again for the spreadsheet.
Your welcome Hawk!