
I have assets saved in a variety of accounts: taxable, tax-deferred, and tax-free.
You too, huh? Good.
So, the other day, I wondered: How long would my savings last if I retired right now?
And then I hunkered down and built a retirement withdrawal calculator to find out.
Do you know how long your savings would last?
If you regularly follow this blog, you know I get very analytical about optimizing finances. I use quantitative data to prove why certain personal finance choices are better than others.
For example, I showed how to optimize your savings strategy by using a Solo 401k to massively tax-shield your assets. And how to double dip the tax benefits of both a traditional and Roth IRA.
In the same vein, I wondered how to spend down retirement savings in the most tax-efficient, wealth-preserving manner.
Are there strategies to maximize how long of a retirement your savings can support?
Well, today I wanna prove there is an objectively correct way to maximize your withdrawals when you retire.
This gets me pumped ‘cause I freakin’ love strategies that increase retirement “mileage” without demanding increased savings. ‘Cause that means you’ve found a way to keep more money in your pocket…and out of Uncle Sam’s.
And who don’t love that!
By following my analysis, you can save hundreds of thousands of dollars over the course of your retirement. That means, without any extra money, you can, in some cases, support many more years of retirement…simply by being deliberate in how you withdraw your money.
The key is: the order in which you withdraw from your retirement accounts matters.
A lot.
I’m gonna walk you through a series of analyses that shows you how different withdrawal structures can lead to very different outcomes.
The big insight here is: depleting your taxable accounts first, and your tax-deferred accounts only second (i.e. IRAs, 401ks) – while doing Roth conversions along the way – will make your portfolio last the longest.
By contrast, the worst way to structure your withdrawals is to withdraw from your tax-deferred accounts first (IRA, 401k). You should let those grow undisturbed for as long as possible.
Cool. Now, before we jump into the analysis, I wanna lay clear all the assumptions I’m making. Every financial model makes assumptions, and I’ve made a bunch (some of which you can edit to your own situation by grabbing a copy of the model here).
My assumptions simplify the calculations but don’t change the directional answer, and it still allows us to create a powerful framework for analyzing retirement outcomes.
OK, here are my assumptions:
- You are married filing joint. Most people in this boat will be married filing joint, so that’s what I assume here. However, the result won’t differ directionally even if you have a different filing status.
- Cash on Day 1. The money in all your accounts on Day 1 is 100% basis held in cash, so there are no unrealized capital gains at the very beginning. This allows us to put everyone on equal footing for analysis purposes.
- You invest only in a passive market-tracking index fund. On Day 1, you invest your nest egg in a passive index fund that tracks the entire market. You hold all your wealth in this fund for life.
- January 1 withdrawal. You withdraw your entire annual spending requirement on January 1 each year; anything leftover in your account accrues capital gain + dividends during the year.
- Dividends go toward spending needs. Dividends earned in your taxable account during the year are applied to next year’s annual spending before any principal from the account is invaded.
- Ordinary taxes on dividends. Dividends are always taxed at ordinary income rates, not qualified or preferred rates.
- Preferential taxes on capital gains. At realization, capital gains are taxed preferentially at 0% if you qualify, otherwise they are taxed at 15%.
- Your withdrawals have proportional basis vs. gain. Any withdrawal from your taxable account is divided between basis vs. capital gain proportionately to the amount of basis vs. gain in the account at the time of withdrawal. (This is important because you are only taxed on the part attributable to capital gain, not basis.)
- Tax-deferred withdrawals are taxed on the entire amount. Withdrawals from your tax-deferred account are taxed on the entire amount since you already took a tax deduction upfront at time of contribution.
- No state income tax. For simplicity of not having to deal with state taxes, I assume you live in a tax-free state like WA, FL, or TX. Even if you live in a high-tax state like CA, it won’t change the results directionally.
- Marginal tax rate = effective tax rate. For calculation simplicity of not having to deal with graduated/marginal tax rates, I assume your marginal rate is the same as your effective tax rate. Again, this won’t change the results directionally, but it drastically simplifies calculations.
- No deductions. For simplicity of not having to deal with itemized and standard deductions, I assume deductions are zero. Again, this simplifies calculations and shouldn’t change the directional answer.
- Retirement starts at 60. You start your retirement withdrawals at 60 to avoid early withdrawal penalties from tax-advantaged accounts.
- RMDs at 71. Required minimum distributions kick in at 71 for tax-deferred accounts. This can sometimes cause significant differences in outcomes.
- Pre-tax withdrawals, but not after-tax amounts, are equalized. The pre-tax withdrawal amount is the same for all scenarios. However, since taxes differ, you’ll end up with different after-tax amounts in each scenario. Ideally, of course, we’d analyze based on after-tax amounts for all scenarios, because ultimately it’s not how much you withdraw that matters, but rather how much you get to keep (and therefore how much you can actually spend). However, modeling this in Google spreadsheets or Excel requires circular formulas – which, for this particular analysis, causes some very strange side effects indeed that make no mathematical sense (I know this because I already tried building the model with circular formulas, which you can check out here if you’re curious, and some cells become truly wacky when they try to resolve the circularity). So, my analysis only compares scenarios based on PRE-TAX withdrawals. Either way, it should yield the same answer: but just know that comparing on an after-tax basis will highlight the financial difference between scenarios even more starkly, yet the answer itself (i.e. what is the “correct” answer) won’t change.
- Roth conversions are limited to the current tax bracket. Roth conversions each year are limited to the difference between your taxable income for that year vs. the income threshold of the next higher tax bracket above you.
Whew! Lots of assumptions, huh?
Oh, not enough? OK, here’s some more. But these you can edit to your own situation by downloading the spreadsheet:
- Your withdrawal for Year 1 is $70,000
- Your taxable account in Year 1 has $600,000 cash
- Your tax-deferred account in Year 1 has $600,000 cash
- Your tax-free account (Roth) in Year 1 has $0
- Your investments appreciate 5% annually (capital gains)
- Your investments pay 3% in dividends annually (dividend yield)
- Therefore, your total annual return on investments is 8% annually
- Inflation is 3% annually
- The IRS income level adjustment (which defines tax bracket income levels) is 2.5% annually
I hope your head doesn’t want to explode right now.
Well, with all these assumptions, what does our analysis actually look like?
Spending = $70,000, Taxable = $600,000, Tax-deferred = $600,000
I analyzed 3 scenarios:
- Withdraw from taxable first, tax-deferred second
- Withdraw from tax-deferred first, taxable second
- Withdraw from taxable first, tax-deferred second, but also convert some money to Roth each year
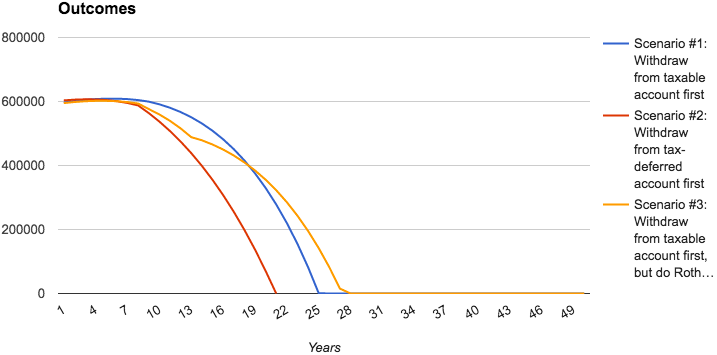
This is how the 3 scenarios stack up against each other:
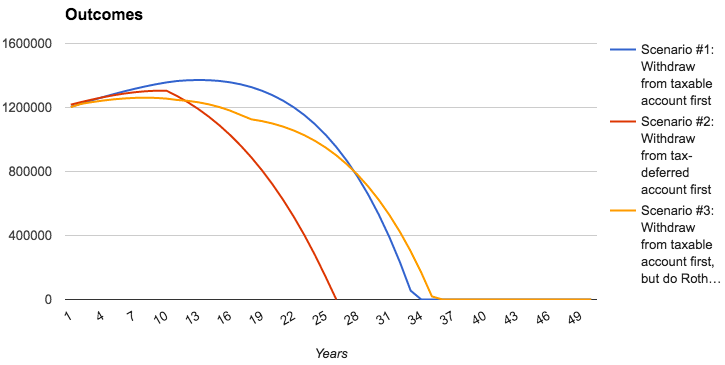
The chart shows how quickly you will spend down your wealth in each scenario, given our assumptions.
Right off the bat, you can see from the red line that scenario #2 (tax-deferred first, taxable second) is by far the worst. It supports less than 25 years of retirement, 8 years shorter than the next best option, and 10 years shorter than the best option.
We see that…
- Scenario #2 (tax-deferred first, taxable second) lasts 25 years
- Scenario #1 (taxable first, tax-deferred second) lasts 33 years
- Scenario #3 (taxable first, tax-deferred second + Roth conversions) lasts 35 years
So, it seems scenario #3 is the best, right?
Let’s look at the underpinnings of each scenario to better understand why the curves behave the way they do, what causes the “kinks” in the curves, and why the blue and orange lines invert midway through.
Here’s scenario #1 up close
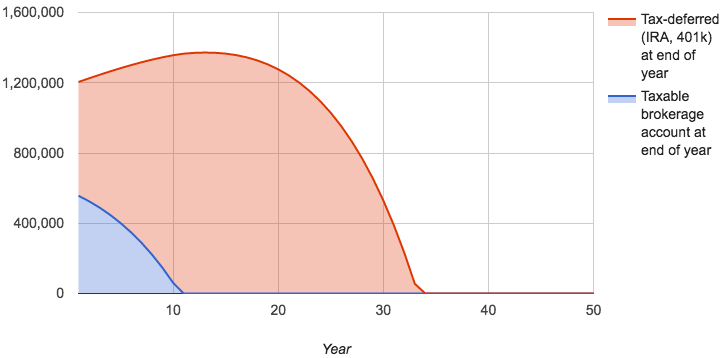
This chart shows what happens when we spend our taxable account first (blue area). As you can see, the taxable account supports about 10 years of retirement under our assumptions.
During those 10 years, our tax-deferred IRAs and 401ks grow undisturbed, compounding on a tax-deferred basis.
Then in Year 11, we run out of taxable funds, so we have to start drawing down our tax-deferred account…which is also why the total account value plateaus then – before beginning to nosedive. Having drained one account, our other account doesn’t grow fast enough to offset annual spending.
And just as positive compounding creates hockey-stick growth, negative compounding – i.e. withdrawals that outpace growth – quickly drains our account as shrinking principal causes remaining principal to shrink even faster.
Now let’s look at scenario #2
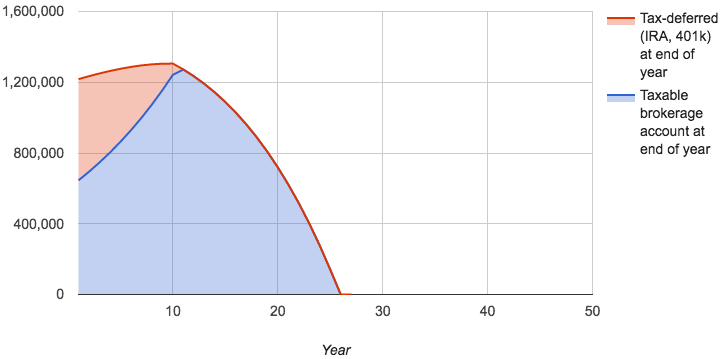
Here, we drain our tax-deferred account first. Like above, we see it lasts for about 10 years before getting drained out. During that time, our taxable account grows undisturbed, but at a slower pace.
That’s ‘cause the taxable account is weighed down by the tax drag: dividends in the taxable account are taxed every year at ordinary rates under our assumptions, whereas dividends in the tax-deferred account grow tax-free and are only taxed at withdrawal.
This prevents our taxable account in scenario #2 from growing as fast as our tax-deferred account did in scenario #1.
Accordingly, the decline is also swifter. Once our first account is drained after 10 years, the taxable account then takes a sharp turn. No smooth plateau/decline like above. It just nosedives.
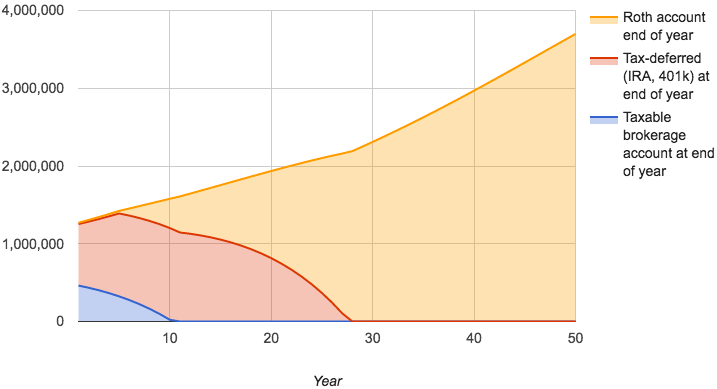
OK, now let’s see what’s happening with scenario #3
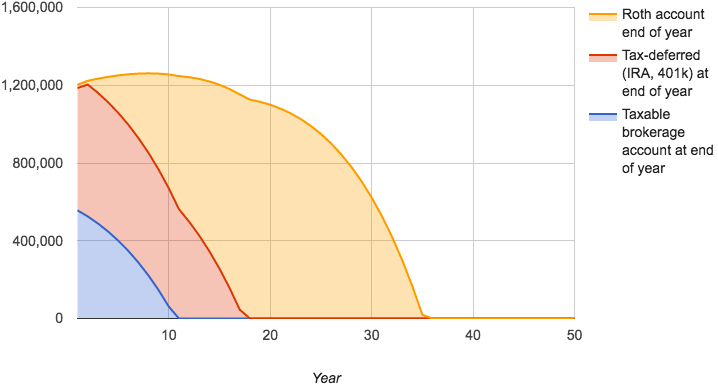
We’ve got some tri-color action going on here.
We’ve got our blue area which is our taxable account, and that gets drained first. It lasts 10 years, just like above.
We’ve got our red area, which is our tax-deferred account. Here, it starts declining immediately because we’re moving money every year from it to our Roth. In doing so, we take a tax hit upfront in exchange for tax-free growth and withdrawals later – that’s our yellow area.
How much are we converting to Roth each year? Based on our assumptions, we limit Roth conversions each year to the difference between your taxable income for that year vs. the income threshold for the next higher tax bracket above you.
So, whatever tax bracket we fall into for the year, we “fill up” the rest of that tax bracket with Roth conversions, such that we don’t get bumped up into the next tax bracket.
And we see that, in this scenario, TOTAL wealth does not grow as quickly as it did in scenario #1 – where we withdrew from our taxable account first, tax-deferred account second, but did no Roth conversions. The reason why it doesn’t grow as fast here is ‘cause we take that extra tax hit from the Roth conversions.
But over the long haul, our nest egg LASTS longer and supports a longer retirement because we’re systematically transferring more and more wealth to a tax-free vehicle.
Hence, when we eventually start draining our Roth, it declines more gently because there are no taxes to pay: taxes evaporate starting year 18, whereas they persist until the very end – i.e. year 34 – in scenario #1.
Now, what about those “kinks” in the red and yellow lines – what are those?
Basically, the kink occurs when the account “under it” gets drained out.
Here’s the intuition. While one account is in the process of getting drained – say, the blue taxable area – it has a downward slope. If the account “above” it (i.e. the red tax-deferred area) is also getting drained via Roth conversions, then it will have its own downward slope.
The two downward slopes combined will create an even steeper slope, which you see reflected in the red line (which actually technically combines both red and blue together).
However, once the blue taxable area is drained out, only the red tax-deferred area remains. So after subtracting blue from red, the slope “kinks” upward a little, because red alone is not as steep as both red and blue together.
The same thing is happening with the kink in the yellow line.
It’s kind of like how you can run faster going downhill than running on flat land. Running downhill is like combining red and blue together because you’re combining your own speed with downhill gravity. But once you reach flat land, it’s just your own speed. Make sense?
OK, now remember this chart?
Why do the blue and yellow lines start out with blue higher, but then invert midway through?
Simple: taxes.
The blue line initially grows faster because the IRAs and 401ks within it grow tax-deferred for longer. However, when it comes time to withdraw from those accounts, a big tax drag kicks in and the blue line starts declining, gently at first, then swiftly. Remember: those tax-deferred accounts are getting taxed at ordinary tax rates, on the entire withdrawal, not capital gains rates.
By contrast, the yellow line grows slower initially because you’re getting hit with 2 taxes each year: one for annual spend, the other for Roth conversions. That may feel sucky (i.e. slower growth); however, when you get to Roth withdrawals, the decline is gentler because the Roth not only grew tax-free but is tax-free upon withdrawal.
In fact, the bigger your nest egg, and the longer your time horizon, the more you have to gain by doing Roth conversions. You take the upfront tax hit, but then you get to watch your moneybags grow tax-free and enjoy tax-free withdrawals.
Plus, guess what else? Remember my assumption above that we’re analyzing based on PRE-TAX amounts for all scenarios?
Well, ideally we’d analyze AFTER-TAX withdrawals for all scenarios, because it doesn’t matter how much you withdraw – what matters is how much you keep.
By analyzing PRE-TAX withdrawals, all our scenarios end up with different AFTER-TAX amounts, because taxes differ.
If we analyzed it the right way, based on AFTER-TAX amounts, we’d see the blue line shrink in duration vs. the yellow Roth line.
That’s ‘cause, in order to produce $1 of after-tax income, we have to withdraw more than $1 of pre-tax income on the blue line. Whereas on the yellow line, when we get to Roth withdrawals, we only need to withdraw exactly $1 to produce $1 of after-tax income.
That’s a much more efficient withdrawal vs. the blue line scenario.
In the chart above, this truth is suppressed because we analyze based on PRE-TAX amounts, so $1 is “worth the same” across ALL lines. And of course, that’s just not the case.
Problem is, there’s no clean way to model the after-tax scenario in Google or Excel because the circular formulas required result in some really weird shit. (I built a version with circular formulas which you can check out here if you’re curious – others have reported similar issues, which occur due to the way the spreadsheet inherently resolves circularity.)
Anyway, all this just means that, while the awesomeness of Roth conversions doesn’t change either way, it would be even more obvious if we could analyze based on comparing after-tax withdrawals.
OK. So I hope walking through these analyses helped you get some intuition behind the different withdrawal strategies.
Let’s summarize stuff. Here are the heuristics we’ve come up with so far:
- Always let your tax-deferred and tax-free accounts grow undisturbed for as long as possible. Do this by draining your taxable accounts first. The length of time you allow your tax-advantaged accounts to compound matters a great deal.
- If your tax bracket is low enough, convert as much as you can to a Roth during your early retirement years. The tax hit upfront will more than pay for itself in future tax-free withdrawals, which means your total nest egg will last longer.
- However, the Roth conversion strategy might not be good if you’re already in a high tax bracket…UNLESS (a) you expect to be in that high tax bracket forever, or (b) you expect tax rates to rise a lot in the future. That’s because Roth conversions force you to pay taxes upfront (at your high marginal rate), but your tax savings later might be lower when you actually withdraw. And anyone can tell you that paying high taxes now to save low taxes in the future is a bad trade.
If you have these 3 heuristics clear in your head, you’re solid.
Now let’s take a look at the analysis when we start to change our assumptions. Try the following cases in the spreadsheet to get an intuitive feel for what’s going on.
Case #1: “short compounding runway”
- Withdrawals for Year 1: $40,000
- Taxable account: $300,000
- Tax-deferred account: $300,000
Notice with this set of assumptions that the gap between the red line vs. other lines is shorter.
The gap between the blue vs. yellow lines is still about 2 years (same as in our $70k / $600k / $600k case above), but the gap between red vs. yellow has now shrunk to 6 years, down from 10 above.
This is because our savings is significantly lower under these new assumptions, so the tax-deferred and Roth accounts have less “runway” – less time – to compound and work their magic.
This highlights the truth that the length of time you allow your tax-advantaged accounts to compound matters greatly.
Let’s try another case.
Case #2: “long compounding runway”
- Withdrawals for Year 1: $70,000
- Taxable account: $500,000
- Tax-deferred account: $750,000
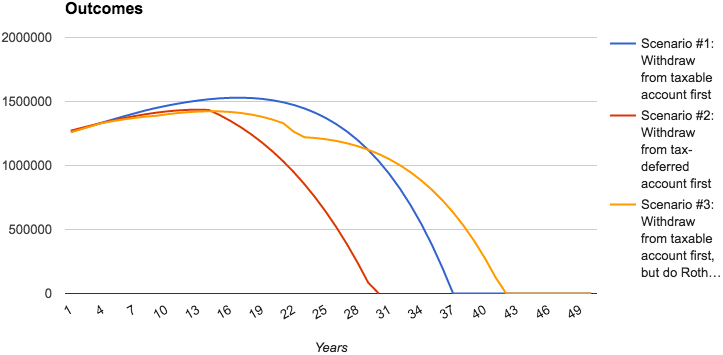
Here, we see the gap between the blue vs. yellow line is bigger: about 5 years. The blue line lasts 36 years and the yellow line lasts 41. The red line lasts 29.
By beefing up our tax-deferred account from the outset, we essentially give it a longer runway to compound. Hence the gap between red vs. yellow in this scenario is 12 years, and the gap between red vs. blue is 7 years.
Again, this emphasizes the point that the length of time your tax-advantaged accounts compound makes a big difference in how long your retirement wealth lasts.
Case #3: “minimal compounding runway”
- Withdrawals for Year 1: $60,000
- Taxable account: $300,000
- Tax-deferred account: $500,000
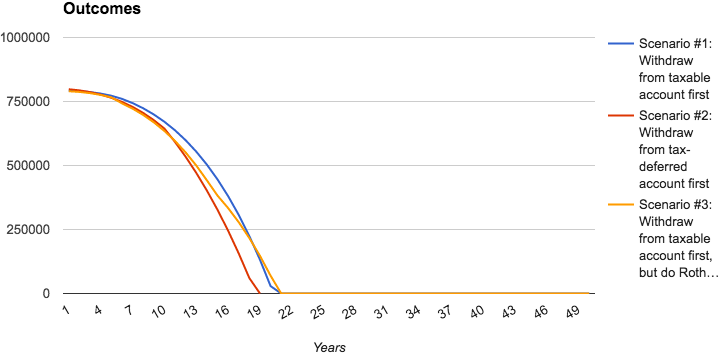
In this case, we see the lines ending almost on top of each other. There’s little difference in how long the scenarios last: the red line lasts 18 years, the blue line 19, and yellow 20 years.
Our withdrawal amount here is high compared to our nest egg. And since our taxable account is small (only $300k), it drains quickly, which means the tax-deferred and Roth accounts have very little time to compound. Hence the minimal difference in outcomes between the 3 scenarios.
Cool. Let’s do one last case.
Case #4: “forever runway”
- Withdrawals for Year 1: $60,000
- Taxable account: $500,000
- Tax-deferred account: $750,000
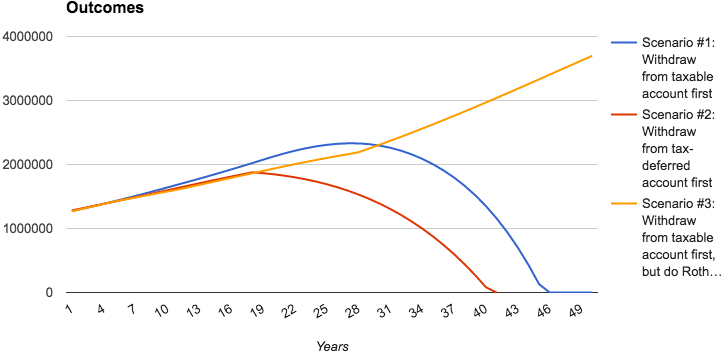
What have we here? Our red and blue lines extend farther, but eventually drain out.
However, our yellow line never drains outs! It grows through year 28, and then it actually kinks UPWARD and grows even faster.
Notice the kink happens when our tax-deferred account drains out:
The kink occurs because the “gravity” of the draining red line was “weighing down” the visible growth trajectory of the yellow line when the two were getting combined together, just like we saw with the kinks discussed way above.
Remember our above analogy where your running speed increases when you’re running downhill vs. running on flat land? Same thing is happening here, but just on a growth trajectory vs. decline trajectory.
So, in the tri-color chart above, the growth of the yellow area is getting blended with the decline of the red area – once the red area drains out, the yellow area grows at its “normal” rate.
But the really interesting insight here is that, there are situations where your retirement accounts end up growing FASTER than your spending needs. When that happens, your retirement horizon is infinite. It means you’ll never run out of nest egg at those spending levels.
This happens when your nest egg size + growth rate produces more dollars each year than you need to spend that year. The leftover amount gets added back to your nest egg and grows further the next year.
4 factors control this outcome:
- Size of nest egg
- Growth rate of nest egg (capital gain, appreciation)
- Your annual spend
- Growth rate of your annual spend (inflation)
If you have a HIGH nest egg growth rate, you need LESS nest egg size to produce this result.
If you have a LOW nest egg growth rate, you need MORE nest egg size to produce this result. (And that’s why if you’re really really rich, like a multi-millionaire or billionaire, it almost doesn’t matter how fast your nest egg grows: it’s so huge that, unless you do something crazy, you’ll never run out of money no matter what the growth rate is.)
If you have LOW annual spend or LOW growth rate in spend, you’ll need LESS nest egg size or growth rate to produce this result.
If you have HIGH annual spend or HIGH growth rate in spend, you’ll need MORE nest egg size or growth rate to produce this result.
It’s hard to control growth rates, because as individuals we have limited control over larger market forces affecting them.
However, it’s easier to control the size of your nest egg and the amount of your annual spend.
Your annual spend is a function of your budget and spending discipline – the subject of countless self-help books and gurus.
Your nest egg size is a function of your annual spend (because that determines your annual savings), how wisely you invest your savings, and how long you invest before you start withdrawing.
Again, this is simple compounding at work: the size of your baseline and the length of your compounding runway determine your outcome.
If your nest egg is large enough, or its growth rate is high enough for a long enough period of time, you might be able to break free of financial “gravity” entirely and make your nest egg last forever, guaranteeing that you never run out of money.
Putting it all together
Let’s tie it all together! How long of a retirement your nest egg can support depends on:
- How big your nest egg is when you retire. And to a lesser extent, how your nest egg is split between taxable, tax-deferred, and tax-free vehicles.
- How fast it’s growing. This determines how large your nest egg “baseline” must be, and how long you’ll have to work until you can retire. Of course, once your nest egg can sustainably produce more dollars each year than you need, you have that magical outcome: infinite runway.
- Your annual spend. The more you need, the more nest egg you’ll require…or the longer you’ll have to work.
- Your desired retirement age. This not only affects how long your retirement will be, it also has important tax considerations. If you have a ton of wealth in tax-deferred or tax-free accounts, you can get hit with significant penalties for withdrawing too early. Typically you cannot withdraw before 59.5. For tax-deferred accounts, it also impacts when RMDs kick in. RMDs won’t affect you if they are less than what you plan to withdraw anyway, but if not they can have big consequences because you’re forced to withdraw more than you want…and pay taxes on it. In extreme cases, it can even force you into a higher tax bracket, which can speed up draining your nest egg. In fact, starting around age 71, the less you need to withdraw, the more adverse the forced tax consequences are. (Solution: do Roth conversions early in retirement.)
- Your current and future tax brackets. If you are in a low tax bracket now, consider doing Roth conversions to take advantage of that low rate and get tax-free growth going forward. If you are in a high tax bracket now, don’t do Roth conversions because you’ll get hit with a high tax upfront; instead, wait until you are in a lower bracket (for example, you can take a gap / holiday year to harvest gains and do conversions), or wait until early retirement to begin converting to Roth. Plus, since Roths have no RMDs, you’re killing 2 birds with one stone using this strategy.
Whew! We finally made it.
Be sure to check out our companion post: How much do you need to retire and how soon can you retire?
Now it’s your turn…
Discussion: Are you persuaded there is an objectively correct withdrawal strategy for retirement? How long will your nest egg last in each scenario? What other strategies are you thinking about to make your nest egg last as long as possible? Leave a comment below and share your thoughts!

great calculator, thanks for taking the time to do this.
The default 2.5% IRS income level adjustment, can you provide the historical data that you pulled that from?
thanks in advance!
It’s an assumption, not a historical citation.
Social Security impact is not taken into consideration?
Correct. This view is more conservative, so if you get social security, it’ll be an additional buffer.
If you retire early, you can withdraw from your tax deferred accounts with zero taxation if you use a Substantially Equal Periodic Payment withdrawal scheme with withdrawal rate of $12K to $24K annually depending on if you file as single or married jointly. Does the tax saving there outweigh the rule of leaving the money in the tax deferred account as long as possible? You can supplement that income with additional income (roughly $24K single, $48K jointly) that comes from $0 taxed capital gains distributions and qualified dividends from your taxable accounts, along with drawing down additional principal from you taxable accounts if you need it.
It’s hard to say whether executing a SEPP using that strategy outweighs letting the money compound over the years in your tax-deferred account.
It depends on:
1. How early you retire
2. Whether you have other income sources available to you
3. How much money you need to support your lifestyle
4. How much you have saved in your tax-deferred accounts right now
Other things being equal, the earlier you retire, the less compounding your tax-deferred account would have. Which means the opportunity cost of taking the money out early is higher.
Other things being equal, if you have other income sources available, then it makes sense to spend that money (and fill up your deduction allowances) first before touching your tax-deferred accounts.
If you need a lot of money to support your lifestyle and will take a tax hit either way because you exceed your deduction allowances, then it *may* not be advantageous to do SEPP because you lose the compounding and are going to get taxed anyway. It’s not entirely clear because it also depends on what your tax rate is when you withdraw the money; at a minimum it requires doing analytical calculations to be sure.
If you have a lot of money saved in your tax-deferred accounts, say, through a consistently maxed out Solo 401k, then you may feel less “pain” in old age by doing SEPP as an early retiree. However, if you don’t have a lot saved up, and you do SEPP early in life, then you may not have much left (or anything at all) by the time you reach senior status.
With the recently passed new tax bill, which doubles the standard deduction, doing a SEPP strategy may be more attractive because the deduction allowances are higher before taxes are owed. However, the deduction allowances, at least as currently legislated, will expire in 2025, so it’s not presently a long-term guarantee.
Very interesting analytical essay! Nice writing!