
If you’ve been following along in the other posts in this series, you know I started Hack Your Wealth on the eve of my marriage. I wanted to take that opportunity to “baseline” my net worth and understand my financial past in order to determine how to strengthen my — and my wife’s — financial future.
So I have spent some time parsing and analyzing my income, spending, savings, and investments to track how my net worth has changed over the years since entering the workforce after graduate school.
In previous posts, I analyzed my overall income and expenses and side project income. In this post, I will analyze my net wealth as a whole, comment on how it’s evolved over time, and reflect on lessons I’ve learned along the way — which can hopefully provide you with some actionable takeaways for your own journey to build financial independence.
As with the other posts in this series, I’ll share with you the exact spreadsheet tools I created to analyze my net wealth, which you can get right here:
Get the Exact Spreadsheet Template I Created to Analyze My Income, Expenses, and Net Wealth
What’s up with my net wealth?

Given what I learned analyzing my all-up income and expenses, I wanted to understand how my net wealth has trended over time as a result. Specifically:
- How quickly had it grown over the years?
- What had caused significant dips and spikes?
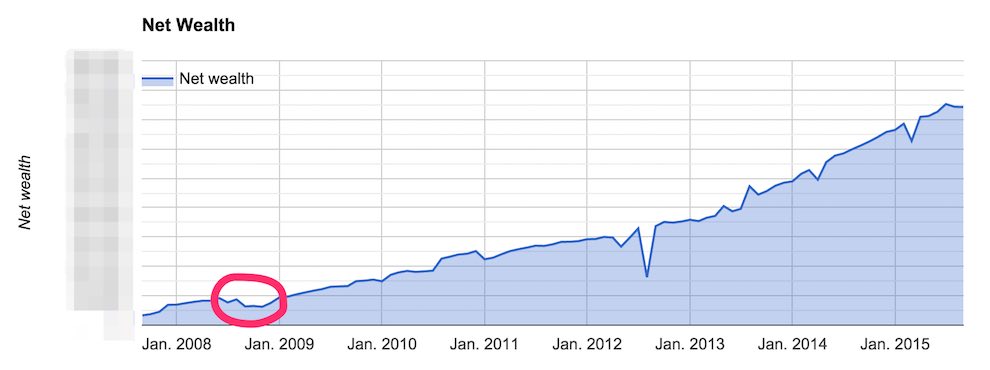
This chart shows how my net wealth has trended over the years.
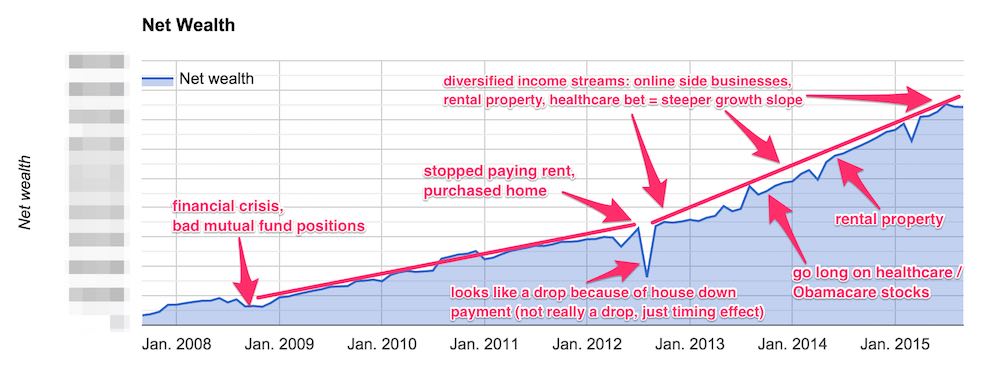
And there were a few observations that jumped out immediately.
1. Net wealth grew faster after I became a homeowner

There were two different growth trajectories whose curves inflected around August / September 2012. The growth trajectory after that date is noticeably steeper than prior to that date.
And this correlates exactly to when I became a homeowner. The reason this is significant is because, by becoming a homeowner, I stopped paying rent and switched to paying mortgage interest instead. And my mortgage interest was cheaper than my rent.
Does that mean owning a home is always better than renting one?
No, but in my case specifically, owning was better, even in the expensive Bay Area where I purchased my home, and it has been a significant driver of net wealth growth.
If you want to see why, check out my post where I break down all the numbers and details.
To be sure, I was definitely lucky in that I purchased before Facebook went public at a time when home prices were fair (but not cheap) relative to their intrinsic values.
Because since then, housing prices have skyrocketed to La La Land.
This has occurred because there have been so many overseas cash buyers in the Bay Area over the last few years that it’s hard to tell how much of the price appreciation is intrinsic, due to local economic growth (including tech sector growth which I believe is intrinsic), vs. speculation, due to an influx of overseas buyers who may lack favorable investment opportunities at home and are searching abroad for places to park their capital.
That’s also the reason why I don’t think I’d buy another investment property in the Bay Area unless it was a special situation or a distressed property. Prices now are just too out of whack.
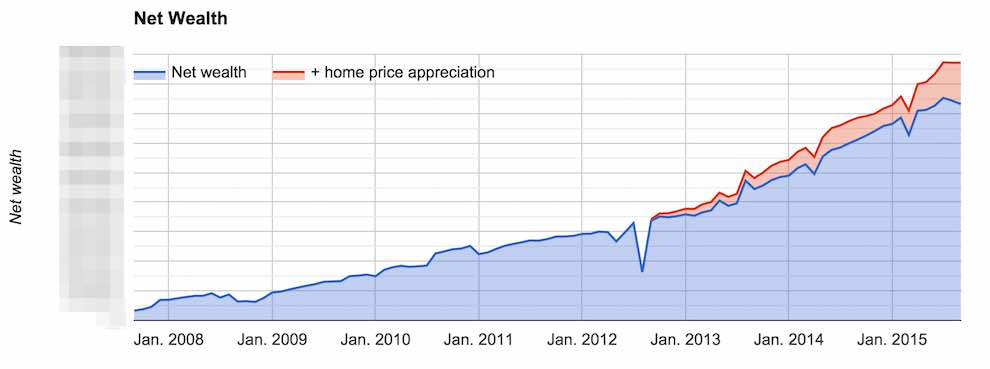
But that doesn’t change anything here because my net worth analysis here does NOT factor in any effects of home price appreciation, which in the Bay Area has been excessive the last couple years.
Rather than guess how much is intrinsic vs. speculation I’m just excluding all of it from my net wealth analysis.
Instead, I’m only using property tax assessment values for this analysis, which are largely static year to year. This helps keep me honest about any price speculation that may be going on.
Otherwise, just for interest, if I incorporate aggregate month by month median sales data from Zillow reflecting home price appreciation for my exact neighborhood, then my net wealth chart would look more like this:
So, if the curve inflection wasn’t due to home price appreciation, then what was it about homeownership that contributed to net wealth growth?
As I said earlier, it’s because my mortgage interest was cheaper than my rent (even more true today). But it’s also because, since 2014, I’ve started collecting rent on the house.
I took a new job in 2014 and moved out of the house to shorten my commute. I rented the house out which helped my net wealth growth accelerate even more.
That’s because the rent offsets the fully loaded expenses of the house and also subsidizes my own rent for the apartment I moved into.
Since 2014 when I started renting out the house, net wealth growth has been especially strong.
2. Net wealth grew faster after I started my online businesses

If real estate blew some tailwinds into my net wealth, so too did my online passive income side projects.
I started my side projects in early 2012 and by early 2013 they started to contribute meaningful amounts of income (at least to me).
And because the ongoing cost of goods sold or maintenance costs for that income (other than a little bit of time) are low, most of it falls to the bottom line as disposable income.
Since 2013, that disposable income has nearly been enough to support my bachelor living expenses, which means I haven’t had to spend much of my salary income, which has allowed me to tuck it away and invest it.
This has had a noticeable impact on my net wealth growth.
3. I invested a sizeable amount of disposable income into a macro bet on healthcare stocks, which blew additional tailwinds into the sails
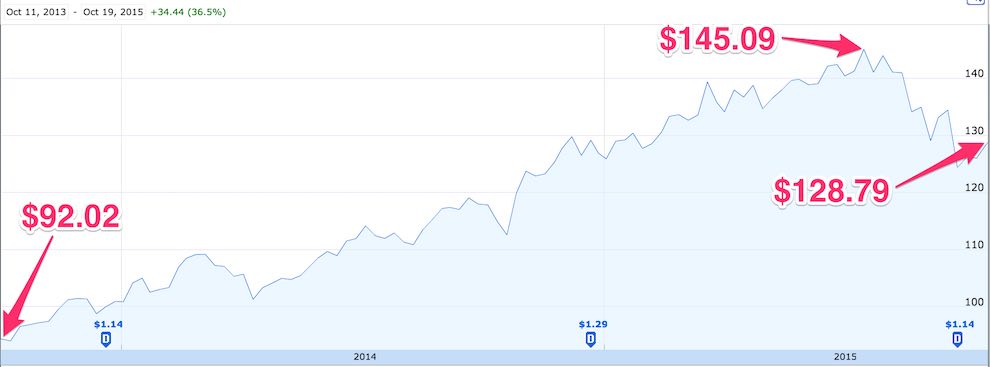
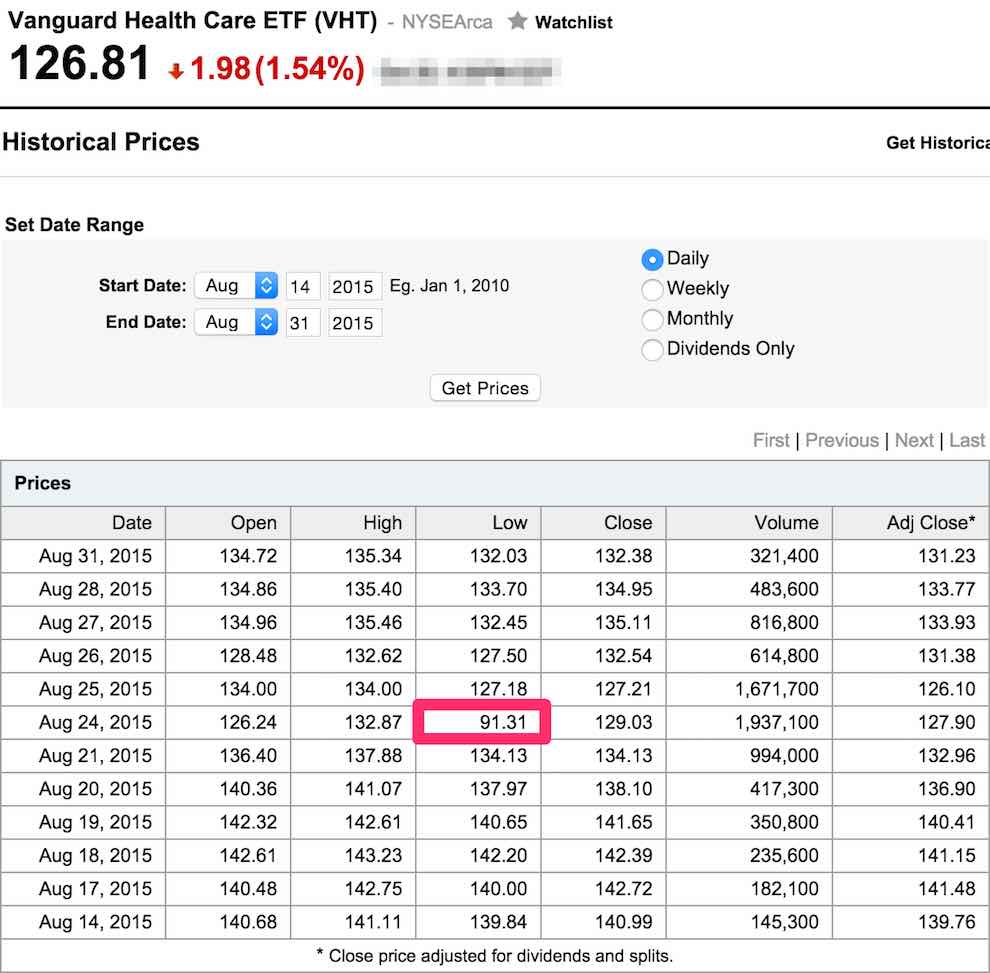
This is the performance of VHT, Vanguard’s Health Care ETF.
The chart shows the period starting from October 8, 2013, when I went all-in investing most of my liquid cash into it at $92.02 a share, until the present day, which at the time of this writing was October 2015, when the ETF closed at $128.79 a share.
During this period it reached a peak of $145.09 a share.
The share price started jittering in the late summer of 2015 after a slew of negative economic reports came out of China related to a slump in both real estate and the public markets there.
But aside from the volatility related to stuttering markets in China, the growth of VHT has been remarkable. It’s enjoyed a steeper ascent than many other investments I’ve made. And you can see at the very end of the chart timeline that it’s even back on the upswing in the last couple weeks.
The only other time I remember enjoying this kind of stock market performance ride was in 2009, when you could have gone long on pretty much anything and performed well, because the public markets took such a smack down the year before.
So, why was I comfortable investing most of my liquid cash into VHT?
On March 23, 2010, President Obama signed into law the Affordable Care Act, known colloquially as Obamacare.
It took a couple years to really get it going after fits and starts and delays — as well as to withstand the numerous legal challenges that ultimately brought the ACA before the United States Supreme Court. Twice.
But it got implemented.
And regardless of your politics and whether you think it was a wise political move, one undeniable economic impact it had was to enlarge the insurance rolls by 16-20 million new patients, increasing the percent insured population by a full 6-7%.
Indeed, according to the US Census Bureau, before the ACA in 2009 about 48.6 million people, or 15.7% of the population, was uninsured. A 2015 study by the CDC using Census data showed the total uninsured rate now to be 9.2%.
That means according to the CDC and the US Census Bureau, the uninsured rate under Obamacare has fallen by 6.5% (or about 20 million new enrollees) from 15.7% to 9.2%, which is the lowest uninsured rate in 50 years.
The Department of Health and Human Services reported that Obamacare lifted insurance rolls by 17.6 million people, according to September 2015 data.
And in May 2015, the RAND corporation estimated that a net total of 16.9 million people have received health coverage under Obamacare.
All these agencies and groups converge on a health insurance market expansion estimate of between 16-20 million newly insured.
Now, what happens when the government forces a market to expand like this?
Well, by converting previously uninsured customers into insured ones — many of whom were too sick to qualify for coverage without Obamacare, or (on the flipside) were too healthy and young to believe they needed it — the government virtually guaranteed increased demand for precisely the medical products and services that insurance subsidizes.
Adding 16-20 million new customers onto health insurance plans means those people are now going to want to go use their insurance to buy healthcare — i.e., the checkups, services, and medicines they can now better afford.
The performance of VHT, which consists of a blend of mostly large-cap pharmaceutical, bio-tech, and medical device company stocks has, I believe, benefited from this government-initiated market expansion.
These companies are selling more of their products and services to a larger market that is now better equipped to pay for them. And that additional purchasing power is being reflected in the share price of VHT.
Hence the steep slope up over the last 2 years.
Oh, and what of China’s stock market jitters that’s caused increased volatility in VHT (along with many other stocks)?
I’m quite literally not worried about it.
Think about it: China’s public markets and real estate markets have little to do with American healthcare markets. I believe the recent volatility is just broad reactionary pullback from investors at the first smell of a potential downturn.
I’m still long on American healthcare companies and I’m still long on VHT.
(And in case you’re wondering, no, VHT and Vanguard are not paying me to say any of this and I don’t get any kind of commission for talking about VHT.)
4. The financial crisis in the fall of 2008 seemed catastrophic at the time, but in the grand scheme of things it was a blip
See this little blip of a dip?

That was the impact of the financial crisis on my net wealth.
Um, so while news commentators were predicting financial armageddon in 2008, in the grand scheme of things, given enough time to recover (which has actually only been 7 years so far), the financial crisis was essentially a hiccup.
But boy, that’s sure not what it felt like at the time.
The markets were utterly collapsing!
My own net wealth plummeted -32% from peak to trough in a single quarter in the winter of 2008.
Yikes.
That’s a drop large enough to make even the most disciplined investor’s skin crawl.
And in particular, my Roth IRA — that oh-so-precious tax-free account — dropped an unimaginable -70% in value.
To add insult to injury, I couldn’t even recoup any tax losses on my Roth IRA account because any gains would have been tax-free to begin with. So losses couldn’t be used to offset taxes, either.
This experience was one of the most painful lessons I’ve ever learned about the difference between speculating on prices vs. investing based on a defensible and reasoned thesis.
Indeed, in the 7 years since, my Roth IRA has only now started to approach its pre-financial crisis levels again.
Seven long years.
And still a bit shy of its high water mark.
Luckily I have built up a lot of other investing accounts even though I can no longer contribute to my old Roth IRA anymore.
But it’s been an important and painful lesson indeed.
The main reason my Roth portfolio took such a beating was because of some really stupid positions I took in a few mutual funds that I didn’t understand sufficiently well.
On March 28, 2006, I placed a trade in EUROX, a US Global Investors Eastern European Fund that invested in companies in Eastern Europe’s emerging markets. I bought at $45.52 a share. I sold at the end of October 2008, during the heart of the financial crisis maelstrom, for $4.47 a share, more than -90% down.
That was just about the dumbest thing I had ever done: selling on emotion at a time when everyone else was also emotionally trying to sell.
That month felt like the financial world might truly end. I watched and read the news like everyone else, and somehow I got it into my head that the price was going straight to zero, so I better sell while I could still salvage something — anything at all.
Even then, I held too long…and then, I held on not long enough. (Because in 2009, pretty much every security in every asset class rallied hard.)
Fear clouded my judgment. Warren Buffett would have rightly been ashamed of me.
Oh wait, there’s more.
On March 30, 2006, I also took a position in TREMX for $28.16. TREMX was a T. Rowe Price International Emerging European & Mediterranean fund. That fund invested in European emerging market companies, particularly in Eastern Europe and the former Soviet Union. I sold in October 2008 for $10.06. Epic fail.
In August 2007, I bought a stake in QFFOX, a quantitative emerging markets mutual fund, at $26.29 a share. I can’t even precisely recall anymore what that fund’s investing thesis was. I think it had something to do with betting on the price of oil. I sold at the end of October 2008 for $10.45 a share. Stupid again, and again.
Finally, in January 2008, I bought a position in FLATX, a Fidelity Latin American fund that invested in companies economically linked to various countries in Latin America. I bought at $61.72 per share. I sold in a heated moment in October 2008 for $22.43. Dumb, dumb, dumb.
There are no excuses for this quadruple stupidity, even if the financial markets were collapsing.
The core of the matter was that I simply didn’t understand the investments I made sufficiently well. Even though it was with my hard-earned money.
I didn’t understand in detail the strategies of the four mutual funds I purchased.
I didn’t spend sufficient time understanding their risks and holdings and return profiles.
And I wasn’t closely following the financial news of Latin America, Eastern Europe, or other emerging markets where these funds invested.
So, when the poop hit the fan in October 2008 and everyone was trying to exit at the same time, I didn’t have a strong thesis I believed in that I could grip onto.
I just thought, “Holy crap, if all these people are selling and the price is plummeting, maybe I should get out, too, before it goes to zero.”
I cannot even begin to tell you how dumb that was.
In fact, sitting here writing this, I cringe just thinking about it.
And even then, I held on too late and sold long after I first considered doing so.
The big lesson for me was to always have a clear, defensible, reasoned thesis that I can actually articulate out loud, and even write down, before I commit to buying anything. Otherwise, I might as well just throw money to the wind.
If you don’t have the interest or time or mettle to go deep on understanding your investments, then I’ll just save you a lot of time and say all you have to do is invest all your money in VTI, Vanguard’s super cheap Total Stock Market ETF.
That’s a passive ETF that literally just mirrors and tracks the overall market (the CRSP US Total Market Index to be exact).
It costs next to nothing, it’s designed to be “set and forget,” and with absolutely zero effort you are guaranteed to match market returns.
You won’t get any outsized returns, but you also won’t lose more than the overall market. And you certainly won’t succumb to the dumb type of trades I made in October 2008.
You can just invest part of your paycheck every month into VTI, and when you withdraw it at retirement 20 years later, you’ll probably be a millionaire.
And no, neither Vanguard nor anyone else is paying me to say that.
Now it’s your turn: actionable takeaways

So, I’ve been alluding to these already, but there are 2 lessons from my net wealth analysis that I think can help you in your own efforts to increase your net wealth.
1. When investing in the public markets, make bets based on a reasoned thesis
My macro thesis was: Anytime the government forcibly enlarges the size of a market, the suppliers and vendors for that market will experience increased sales as well. And that should get reflected into the stock price.
Moreover, given rising rates of chronic conditions like obesity, diabetes, and heart disease, coupled with greater overall health awareness of such conditions, a government-enlarged healthcare market is unlikely to shrink back down anytime soon.
So, bigger market created by the government + favorable conditions for maintaining (and growing) that market = more revenue for the market = higher stock prices.
It’s important to be able to articulate a thesis like this, at least to yourself, for why you are making an investment in a particular sector or a particular stock.
If you are unable to do this, or you don’t have the patience to do it, then it’s no better than speculating on prices.
It’s gambling, not investing.
In fact, if you’re going to gamble, you might as well go to Vegas and do it instead rather than investing in the public markets. That way at least you’ll have some fun!
As for my healthcare bet, after China’s late summer jitters see-sawed new volatility into the markets, prices are at a low for the year, which I believe now presents a buying opportunity.
Investors are pulling back because they fear China’s impact on global markets like raw materials and manufacturing, not because of fundamental weakness in the American healthcare sector.
In fact, I’m doubling down on healthcare.
I’m just kicking myself for not having had a trade in place to capitalize on the extreme volatility that occurred on August 24, 2015, when the ETF briefly dropped -28% all the way back down to $91.31 for a few minutes.
VHT is a good ETF and I’m not selling my position in it.
But I also learned of a really intriguing and potentially even better investment vehicle to reinforce my macro healthcare bet.
Enter: Motif Investing.
If you haven’t heard of it yet, Motif Investing is an intriguing online investment brokerage I’ve started to use that charges no administrative fees and offers the ability to invest in “motifs” rather than individual stocks.
From their website: “A motif is a basket of up to 30 stocks or ETFs intelligently weighted to reflect an investment theme, market insight or innovative trend.”
This is exactly the same as betting on and investing in a macro thesis.
On the Motif platform, they have pre-existing professionally built motifs based on trends like globalization, resource scarcity, disruptive technologies, and changing consumer preferences that you can invest in from Day 1 — with themes like “connected cars,” “rising interest rates,” or “shale oil.”
But you can also modify, customize, tweak, and re-balance any pre-existing motifs, or simply design your own from scratch.
Then you can buy the whole motif (containing the individual stock weightings within it) in one click. It costs $9.95 per trade, the same price many other online brokers charge for a single stock trade, but you get up to 30 stocks inside a motif as opposed to just 1.
The Motif community collectively has built more than 180,000 motifs, which can inspire your own ideas for coming up with interesting investment theses.
The platform even has an actual “Obamacare” motif, which caught my eye.
The Obamacare motif is well-diversified among different types of healthcare companies. The biggest two holdings, comprising 40% of the motif, are Pharmacy Benefit Managers: CVS Health and Express Scripts.
Then there is a 26% weighting toward hospitals like HCA and Universal Health Services.
Another 21% weighted toward electronic medical records and ~12% divided between generic drug makers, Medicaid services, and insurance exchanges.
Overall, it seems pretty well balanced between health services, hospital systems, technology, and pharmaceuticals.
So even though a golden opportunity has passed to double down on VHT when it was briefly, magnificently down, I’ve made a big investment in Motif’s Obamacare thesis instead.
Not only does it contain a diversified group of healthcare companies well-positioned to benefit from the rollout of Obamacare, but it’s especially useful to also have the option to customize the motif to your own liking, if (for instance) you decide you want different weightings or different companies entirely in the motif because you believe something different about how Obamacare will impact the healthcare sector.
This actually segues nicely into my next actionable takeaway….
2. Diversify with index funds. Buy and hold. Don’t invest in individual stocks unless you are a very skilled professional investor. Focus on macro bets.
There are a lot of professional investors who spend all their time analyzing stocks of individual companies. Even then, they typically only cover a handful of stocks, not dozens.
They learn everything humanly possible about the companies they cover — products and service lines, revenue and cost breakdowns, corporate governance decisions, strategy details, management team quirks, even corporate culture strengths and weaknesses.
They do this all day, every day.
I’m assuming most of you have non-investing day jobs, or something else you’re doing with your time that isn’t analyzing stocks.
My advice is, unless you are very skilled at analyzing companies and financial statements, and researching, studying, and investing in securities as your day job, don’t try to make bets investing in individual companies.
It’s unlikely you’ll outperform professional investors who are spending their every waking minute studying those companies.
You won’t have the time to keep up with all the news and developments related to those companies that could impact trading decisions.
Instead, diversify your risk by buying and holding investments that track some kind of index. They could be ETFs, mutual funds (if you can justify their fees), or other instruments that trade like a stock but spread risk among a basket of assets.
It takes a very skilled investor to translate what’s going on in terms of macro events in the world — political, economic, social — and synthesize those with what’s going on internally at a company, analyzing the company’s fundamental performance in light of those broader forces and trends, and then developing a thesis about that specific company’s value and whether its price properly reflects its value.
But even if you’re not a professional investor, you can still make reasonable macro bets on an entire industry, without necessarily knowing the details of specific companies in the industry.
For example, between manufacturing vs. healthcare, which sector are you more optimistic about? What about between retail vs. energy?
You probably have a gut feeling about this on some level. I certainly do. What is causing that gut feeling? Being able to articulate this and point to specific facts and events is what helps you develop an investable thesis for making a macro bet on an industry.
Making a reasoned macro bet doesn’t require specialized financial skills. Just common sense and paying attention to the news and what’s going on in the economy and society. And nearly everyone is qualified to do that.
All right! This was another long analysis, but hopefully it was insightful to you and you’re able to benefit from some of the lessons I learned from the school of hard knocks to make smarter choices than I did about growing your own net wealth.
Be sure to grab the free spreadsheet I created to analyze my income, spending, and net wealth; you can use it to do the same analysis for your own financial situation:
In the future, I’ll do periodic updates on how my net wealth is trending to share with you new tips and insights I’m learning along the way. The journey is gonna be exciting!
Until then, be sure to check out other posts in this series:
- Income and Expenses
- Side Business Income
- Net Worth – you’re reading this post!
Also, please comment below to share your own success stories or hard lessons learned in building your net wealth. Hearing from readers is always my favorite thing and I try to respond to all comments and email!
[…] investing […]