
K and I recently bought an investment property to house hack. This is the 2nd post of a new series on strategy and tactics for how to house hack in an expensive market, using our own example as a case study.
My wife and I recently bought a 4-plex. We knew the area pretty well already so we had a little bit of an information advantage when due diligencing the property.
But we also looked at investing out of town. It’s a lot harder to due diligence a real estate market when you’re not familiar with it or living in it. But it’s possible.
What’s the best way to do it?
I wrote in my post on House Hacking San Francisco Bay Area style that a critical part of the research is understanding macroeconomic / demographic trends of the area you want to invest in. As a real estate investor, you should have a strong opinion of the “path of progress” and how you can get in front of it.
The best way to get smart on your target market is to start with the city’s Comprehensive Annual Financial Report. The CAFR is a set of independently audited city financial statements, prepared by the city’s finance department, that is basically the annual report for a city. Just like publicly traded companies file 10-K reports, cities file CAFRs. The CAFR follows generally accepted accounting principles (GAAP), which makes interpretation easier.
It’s chock full of data on local employers/industries, population and job growth, economics and demographics, new construction statistics, affordability, local government. It also has detailed financial statements for every aspect of city spending. Tons of stuff you’d want to know as an investor.
The CAFR will give you insight on the path of progress and why the area may or may not be a good bet. You should want that insight early because, if the city is declining (rust belt, old manufacturing town) or is a one-industry town, it’ll be a struggle for your investing efforts even if prices are low. Lipstick on a pig is still a pig.
While it’s long and complex, if you’re efficient with time, flipping through a CAFR should only take ~30-60 min, but you have to know what to look for, so the first time it’ll take longer. But it’s well worth the investment.
In this post, I’ll cite examples from Austin’s 2020 CAFR to highlight stuff (because I like Austin and would invest there in the future).
CAFR breakdown
Every CAFR has three main sections: Intro, Financial, and Statistical. Together, they provide details on how the city is operated/managed, capital improvement plans, economics and demographics.
The Intro orients you to the city’s org structure, operations, and critical services. It will contain a “Transmittal Letter” which is basically an executive summary. In it, there’s a good overview of the overall market.
The Financial Section has audited financial statements for city operations, as well as notes and management’s discussion and analysis (MD&A).
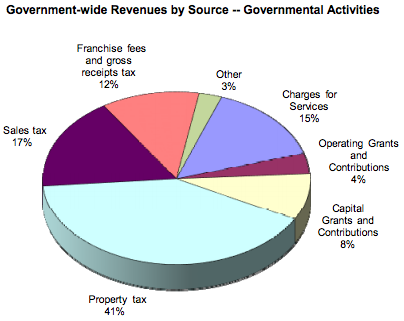
For example, in Austin’s CAFR, we can see the city’s consolidated government-wide financial statements on page 34 of 308.
The CAFR will contain separate financial statements (which may or may not be audited) for various major city funds. Among them will be a “General Fund,” which is the city government’s primary operating fund.
Austin, for example, has these funds, listed on page 32 of 308.
You’ll find the General Fund under “Schedule of Revenues, Expenditures, and Changes in Fund Balances” on page 148. The General Fund gives you a good sense of how the city makes money vs. spends money.
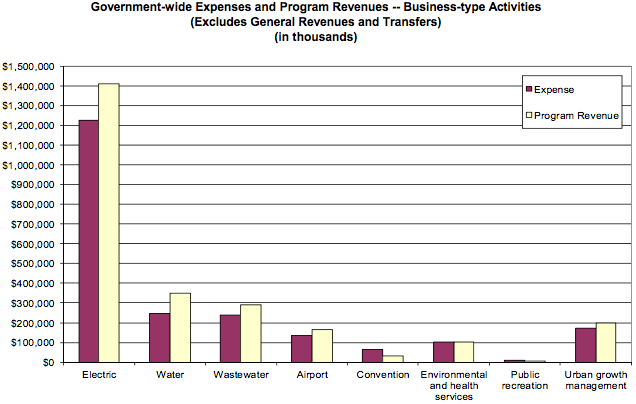
For the other city funds (capital projects, debt service, proprietary funds), you can get into the weeds and look at their financials, but for a high-level overview I usually pay the most attention to the General Fund.
It may seem boring, but spend some time studying the government-wide and general fund statements.
You should understand what the main revenue and cost drivers are for the city. After all, you’re considering to be a future taxpayer, so don’t you want to make sure your hard-earned tax dollars aren’t being wasted?
Most of the time, you’ll see revenue consists of income, property, and/or sales taxes while expenses are dominated by city services.
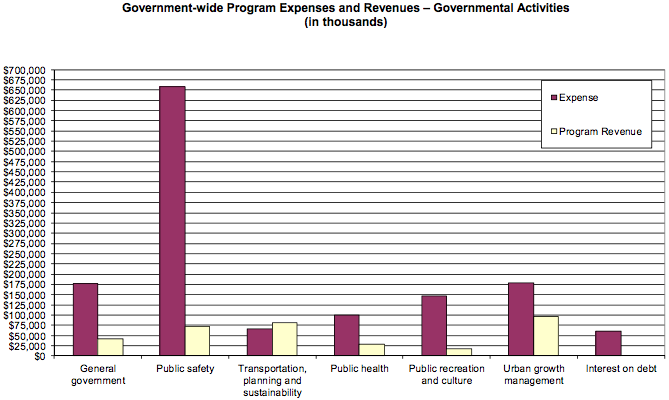
Austin is no exception. A lot of money is spent on public safety (police, fire, emergency medical). In drilldown statements later in the CAFR, you’ll see most of that money is spent on salaries and benefits (unsurprisingly).
In this case, it might be worth looking up local crime rates and first responder times to check how effective the city has been providing these services, given how much budget they consume.
The Statistical Section presents up to 10 years of detailed stats on economic, demographic, and city spending trends. This helps put the current year’s report into better context. I use this to understand how the city has been evolving in recent years and where it might be headed in the near future.
Let’s walkthrough Austin’s CAFR
With all that as context, let’s walk through some key insights in Austin’s CAFR to get some practice analyzing these reports.
First, let’s look at the transmittal letter at the beginning of the CAFR. There we’ll find some interesting nuggets.
On population growth
- Austin is the 4th largest city in Texas (behind Houston, Dallas, San Antonio), 11th largest nationally
- September 2020 population: 1,006,727
- Over the past 10 years, population increased +25% by 201,065
- Median household income: $69,001
- Per capita income: $67,400
On education
- 52% of adults 25 or older have a bachelor’s or advanced degree vs. 32% nationally
- Austin area has 6 universities, plus community college system and other vocational/specialized schools
- The University of Texas at Austin is one of the 10 largest public universities in terms of undergrad enrollment. 2021 U.S. News and World Report ranked UT 13th among public universities and its business programs ranked 5th nationally across all universities.
This is good news for us because an educated community with multiple strong higher learning institutions should translate to higher wages and a stronger tenant base.
Since there are so many students in Austin, student rentals (where you can charge by the bedroom, not just by the unit) may be a viable strategy. Since they usually have roommates, renting to students by the bedroom can be significantly more profitable than renting the unit as a whole. To be sure, students can also bring extra headaches (booze, parties, smoking, drugs), and increased logistics (annual turnover, roommate fights, single vacant rooms), but you can always require parents to co-sign the lease for damages/unpaid rent and charge higher security deposits. If you have the appetite for it, you can make good money with this strategy.
Finally, a strong student population means there will probably be good nightlife, restaurants, and bars. (Austin is the live music capital of the world.)
On employer diversity
The question to ask is, if the top employer left, would it significantly harm the city?
You want to see a diverse employer mix, not a large concentration of employees attached to just 1-2 employers.
For Austin, we have a couple data points to guide us. On page 298, we can see a list of the largest employers.
First, the top 10 employers by headcount. We see the top employer is actually pretty substantial at 3.6% of all employees.
But I’m not worried about them leaving because that employer is the state government itself, and Austin is the capital of the state. They’re not going anywhere.
Number two at 2.5% of employees is the University of Texas at Austin. Yup, they’re not going anywhere either – the name of the university wouldn’t make sense anywhere else after all!
Number four at 1.6% of employees is the federal government, and – you guessed it again – they’re not moving.
Number five at 1.35% of employees is the City of Austin municipal government, and they’re definitely not moving.
Number three is HEB with 1.7% of employees, and number six is Dell Computer, employing 1.3% of the area. Companies can be flight risks, but HEB and Dell are probably safe because Dell was founded in Austin by a UT-Austin dropout, it has strong ties to UT-Austin, and its identity is strongly rooted in Austin, and HEB is a Texas-native grocery chain.
Austin Independent School District (#8 at 1%) also ain’t going nowhere.
So, already, 7 out of the top 8 employers are very unlikely to ever leave Austin. And as of this report, that amounts to ~13% of Austin’s employee headcount.
Other employers on the list are corporations and healthcare networks, which certainly have a higher risk of leaving, but overall I feel pretty good that the biggest Austin employers are here to stay.
Another thing: the employers on this list are reasonably diverse in terms of industries (healthcare, tech, retail, government), so even if one entire industry shut down, it probably wouldn’t do permanent damage to the city.
Another point of assurance is, compared to 10 years ago, many of these top employers actually shrank their percent share of total Austin employees, which means they’re even less concentrated today than they were back then. A good thing.
The second interesting data point on employers is the ranking of top employer taxpayers (Texas does not have state income tax), found on page 289.
Here, we see a somewhat different list of employers ranked by their property tax assessments.
Obviously government entities drop off the list (government doesn’t tax itself). What’s left is a mix of tech, retail, manufacturing, real estate, healthcare, and a few other companies.
The concentration in any one property taxpayer has generally shrank vs. 10 years ago (now, nearly every top taxpayer is less than half a percent of the tax base).
On housing
- Home sales for 2020 were up +1.7% vs. 2019
- >40k home sales in 2020, which is +20% over 2019
- Median SFH prices continue rising to an all-time high of $420k, up +6.3% vs. previous year at $395k
- Since 2012, median home prices increased +40%, which has priced more and more families out of the home buying market
On property taxes
We see the impact of all this growth and expansion reflected in property tax revenue growth, shown on page 284. A rapidly growing city will naturally expand upward and outward, creating new property tax revenue for city government.
We see that property taxes (largest revenue source) more than doubled over the last 10 years vs. virtually every other revenue source which grew more modestly. Sales taxes, the second largest, grew “only” 63% over the same period.
The swift growth in property taxes is likely due to a combo of appreciation + expansion.
A rough way to think about it: expansion probably accounted for roughly 63% of the property tax growth, consistent with the 63% growth in sales tax revenue, because more people moving into an area should roughly correspond to a proportional increase in consumption, which in turn drives sales taxes.
Appreciation probably accounts for the remaining ~40% of property tax growth, because individual consumption (sales taxes) wouldn’t increase with appreciation. You don’t (generally) buy more stuff just because your property value went up.
Lastly, we have a chart on page 287 that shows the breakdown of taxable property value by property class (SFH, multifamily, commercial, etc), which gives an idea of Austin’s property tax distribution.
On government operations
The CAFR also gives us insight into local government operations, like FTE headcount for the last 10 years on page 299.
Stats on a wide range of government services on pages 300-302.
And government facilities operated on pages 303-304.
This helps shed light into how tax dollars are being spent.
If you’re a very detailed financial analyst, you can even line up P&Ls for the General Fund and other specialty funds to calculate revenue and expense ratios and analyze trends in operational efficiency for different government programs and services. That’s beyond the scope of this post, but if you’re so inclined there’s more than enough data to go deep.
Conclusion
Overall, analyzing Austin’s CAFR, I would consider it an attractive area to invest in real estate. Most indicators and metrics we care about are “up and to the right.”
The city is growing, has diverse industries, strong educational institutions, and likely many renter profiles we can appeal to.
The CAFR also points us to Austin Finance, a website with an extensive library of budget and financial documents free to download, and may be worth checking out to dig even deeper if you want more analysis beyond the CAFR.
Of course, just because Austin is attractive doesn’t mean you can find good deals. In fact, many other investors probably did this same analysis and decided to invest in Austin too, which will fuel competition and is probably contributing significantly to home price appreciation noted above. Competition will lower returns / cap rates and make it harder for everyone to buy.
Learning how to find good deals, develop a healthy pipeline of leads, and even find off-market deals is an entirely separate skillset you’ll have to get good at after you’ve identified your target market.
But before you start investing lots of energy in that, before you start looking at properties in person, it’s worth spending a couple hours doing analysis and research on the market.
The analysis we just walked through using the city’s CAFR is a great starting point for getting insights!
Next: How to do a property inspection step by step
In the next post, I’ll show you how to methodically inspect a property step by step, what exactly to look for, and how to judge whether something is a deal-breaker or not.
I’ll also show you how to think about repositioning a property to add value and make it a magnet for desirable tenants and high rents.
Finally, I’ll share a tip/strategy that has saved my a** over and over again. Now I do it on every property I visit.
Check out my post here on how to do a residential property inspection step by step (what smart real estate investors look for).
Check out all the posts in this series:
- House Hacking San Francisco Bay Area style (how we’re creating real estate wealth by having others pay our mortgage on a multi-million dollar house)
- You are here: How to research real estate markets (the single best resource you need)
- How to do a residential property inspection step by step (what smart real estate investors look for)
- How to write an offer to purchase a house (that stands out and wins)
- How to minimize rental vacancy before you close on a new rental property purchase
- How to find and vet good contractors like a boss (for home remodeling and repairs)
- Battle-tested home remodeling tips for saving serious money and getting the most from your contractors
- How to find great tenants for your rental property in 4 simple steps that take 1 hour or less
Plus: make sure you think about your real estate tax strategy from the very beginning. Check out my post on how to avoid capital gains taxes when selling your house to get up to speed.
Also: learn from some of the best real estate investors in the business from our post: 18 real estate investors share what they wish they knew at college graduation.

Leave a Reply